Find a Memory Leak
Sample application | |
In this tutorial, we'll see how you can use dotMemory to locate and fix memory leaks in your apps. But before moving on, let's agree on what a memory leak is.
What is a memory leak?
According to the most popular definition, a memory leak is a result of incorrect memory management when "an object is stored in memory but cannot be accessed by the running code." In addition, "memory leaks add up over time, and if they are not cleaned up, the system eventually runs out of memory."
Actually, if we'll strictly follow the definition above, "classic" memory leaks are not possible in .NET apps. Garbage Collector (GC) fully controls memory release and removes all objects that cannot be accessed by the code. Moreover, after the app is closed, GC entirely frees the memory occupied by the app. Nevertheless, point #2 (memory exhaustion because of a leak) is quite real. Of course, this won't crash the system, but sooner or later the app will raise an OutOfMemory exception.
Why can this happen? The thing is, GC collects only unreferenced objects. If there's a reference to an object you don't know about, GC won't collect the object. Therefore, the main tactic in fixing memory leaks is to determine objects that add up over time (causing the leaks) as well as the objects that retain the former ones in memory.
Let's try this tactic for fixing a leak in our sample application.
Sample application
Once again, the app we'll use for our tutorial is Conway's Game of Life. Download the application from github before proceeding any further. Let's assume we want to return some money spent on the Game of Life development and decide to add a window that show various ads to users. Following worst practices, we show our ad window every time a user starts Game of Life (clicks the Start button). When a user clicks a banner, he/she is redirected to some website and the ad window is closed (the user may also close the window using the standard close button, though that's not what we really want). To change ads, the ad window uses a timer (based on the DispatcherTimer class). You can see the implementation of the AdWindow class in the AdWindow.cs file.
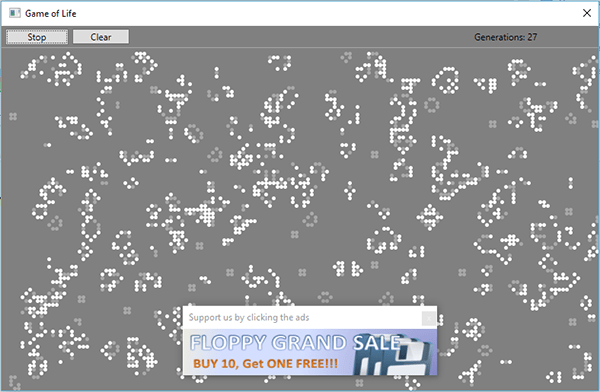
So, the feature is added and now is the best time to test it. Let's run dotMemory and ensure that the ad window doesn't affect the application's memory usage (in other words, it is correctly allocated and collected).
Step 1. Run dotMemory
Open the Game of Life solution in Visual Studio.
Run dotMemory using the menu .
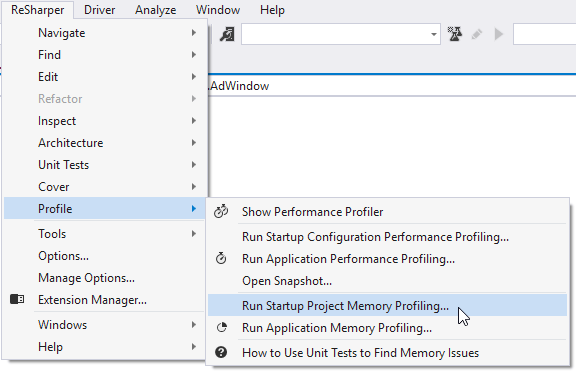
This will open the Profiler Configuration window.
In the Profiler Configuration window, select Collect memory allocation and traffic data from start. This will tell dotMemory to start collecting profiling data right after the app is launched. Here's what the window should look like after you specify the options:
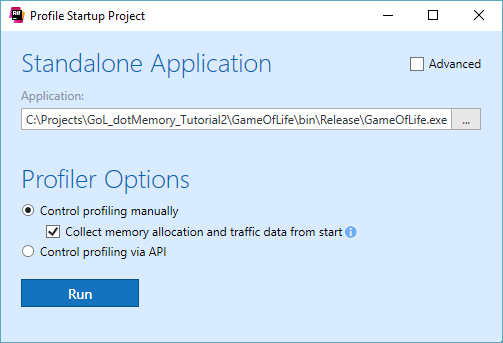
Click Run to start the profiling session. This will run our app and open the main Analysis page in dotMemory.
Step 2. Get snapshots
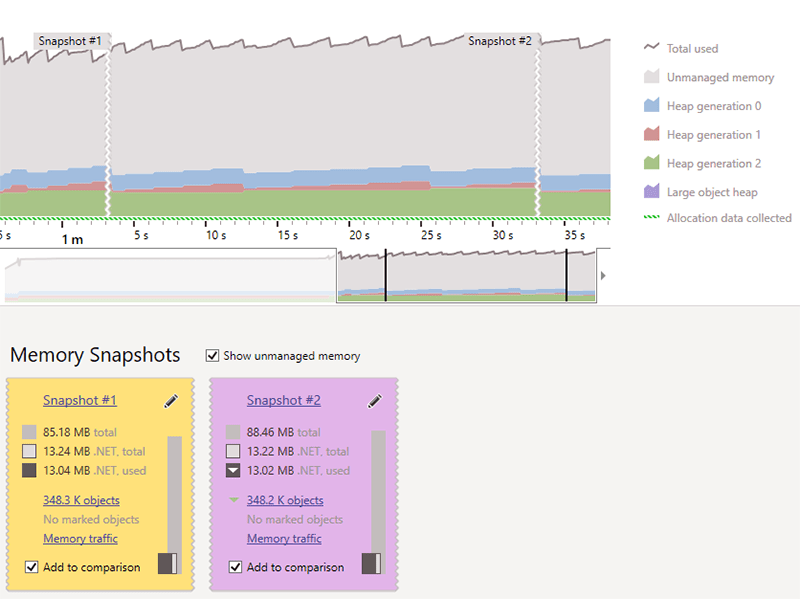
Once the app is running, we can get a memory snapshot. As we want to test our new ad windows and how they affect memory usage, we'll need to take two snapshots: one right after the windows are displayed (we'll use this snapshot as a basis for comparison), and another after the ad windows are closed. The second snapshot is needed to ensure that GC removes our windows from memory.
Start the game by clicking the Start button in the app. The ad window will appear.

Click the Get Snapshot button in dotMemory.
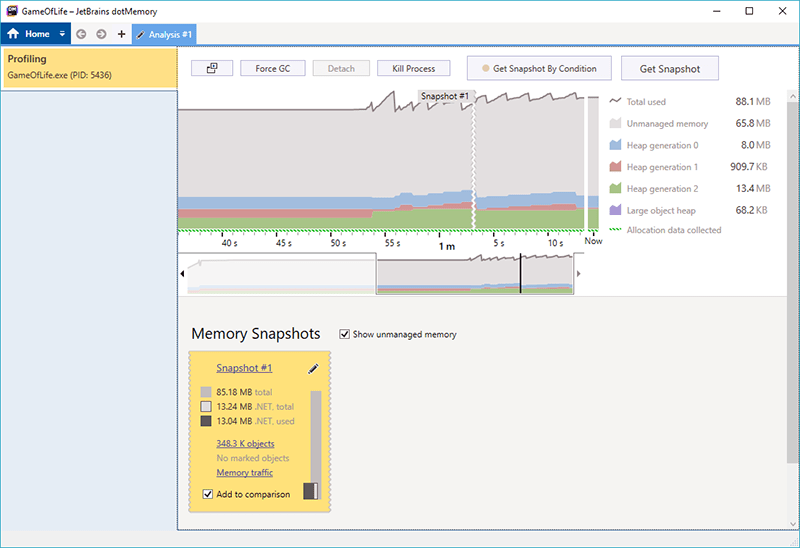
This will capture the data and add the snapshot to the snapshot area. Getting a snapshot doesn't interrupt the profiling process, thus allowing us to get another snapshot.
Close the ad window in the application.
Get a snapshot one more time by clicking the Get Snapshot button in dotMemory.
End the profiling session by closing the Game of Life application. The main page now contains two snapshots.
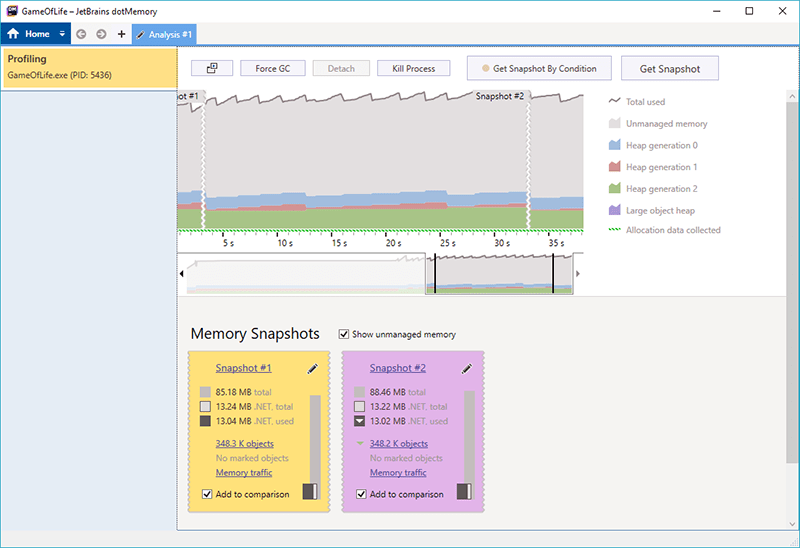
Step 3. Compare snapshots
Now, we'll compare and contrast the two collected snapshots. What do we want to see? If everything works fine, the ad window should be present in the first snapshot but absent in the second. Let's take a look.
Click Add to comparison for each snapshot to add them to the comparison area. The order in which you add snapshots is not important as dotMemory always uses the older snapshot as the basis for comparison.
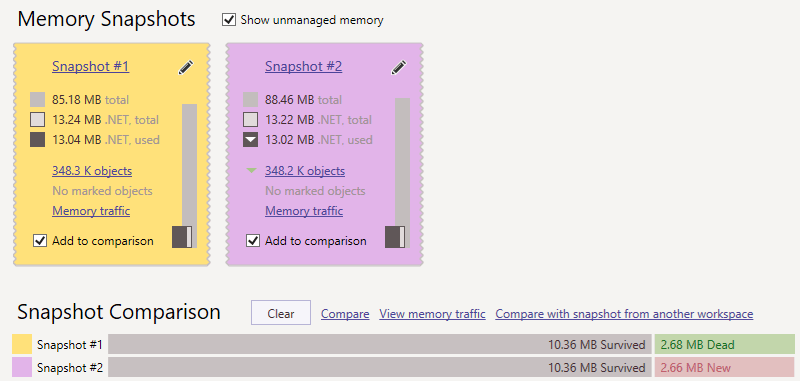
Click Compare in the comparison area. This will open the Snapshots comparison view.
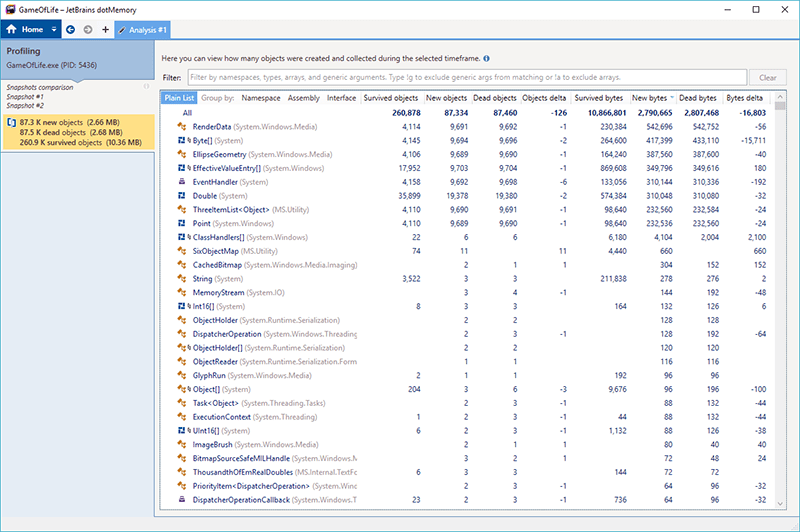
The view shows how many objects of a certain class were created (the New objects column) and removed (the Dead objects column) between snapshots. Survived objects shows how many objects have survived garbage collection, or, in other words, exist in both snapshots. Currently, we're interested in the
AdWindowclass.To ease the finding of the
AdWindowclass, let's sort all objects by the namespace they belong to. To do this, click Namespace in the Group by list on top of the table.Open the
GameOfLifenamespace.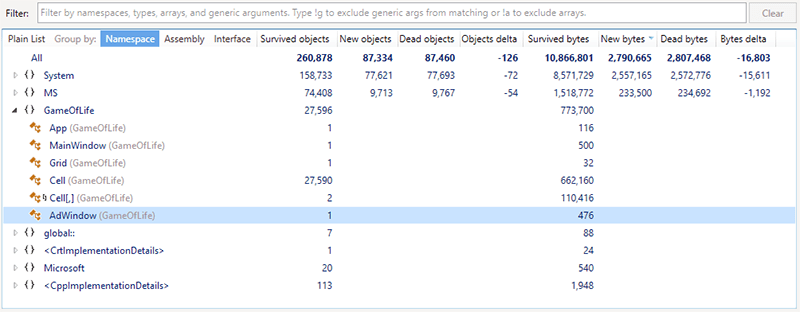
What's that? The
GameOfLife.AdWindowobject is in the Survived objects column, which means that the ad window is still alive. After we closed the window, the corresponding object should have been removed from the heap. Nevertheless, something has prevented it from being collected.
It's time to start our investigation and find out why our ad window has not been removed!
Step 4. Analyze the snapshot
As mentioned in the How to Get Started with dotMemory tutorial, you should think of your work in dotMemory as of crime investigation. You start your investigation by analyzing a huge list of suspects (objects) and continuously narrow the list until you find the one that causes the issue. Your chain of reasoning is shown in the so-called Analysis Path on the left side of the dotMemory window.
Let's try this approach in action:
Open the survived
GameOfLife.AdWindowinstance. To do this, click the number 1 in the Survived objects column next to theGameOfLife.AdWindowclass.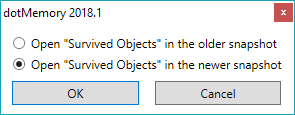
As the object exists in both snapshots, dotMemory will prompt you to specify in which snapshot the object should be shown. Of course, we're interested in the last snapshot where the window should have been collected.
Select Open "Survived Objects" in the newer snapshot and click OK.
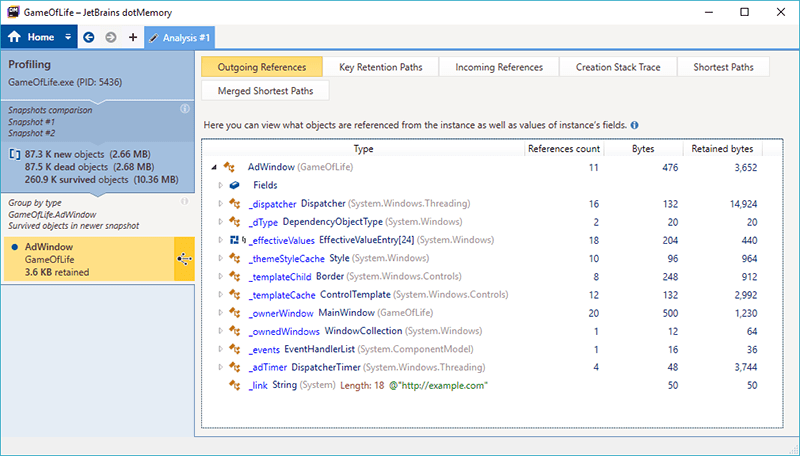
This will show us the instance "The instance of the
AdWindowclass that exist both in snapshot #1 and #2". Note that the list of possible views for instances differs from the one of an object set. For example, the default view for an object instance is Outgoing References that shows the tree of instance's references to other objects. Nevertheless, we're interested not in the objects that are referenced byAdWindow, but only in those that reference it, or, in other words, retain the ad window in memory. To figure this out, we can switch to the Key Retention Paths view. This view shows the graph of retention paths. Note that the view shows not all possible paths, but only those that differ from each other most significantly. This excludes a huge number of very similar retention paths and simplifies the analysis.Click Key Retention Paths in the list of views.
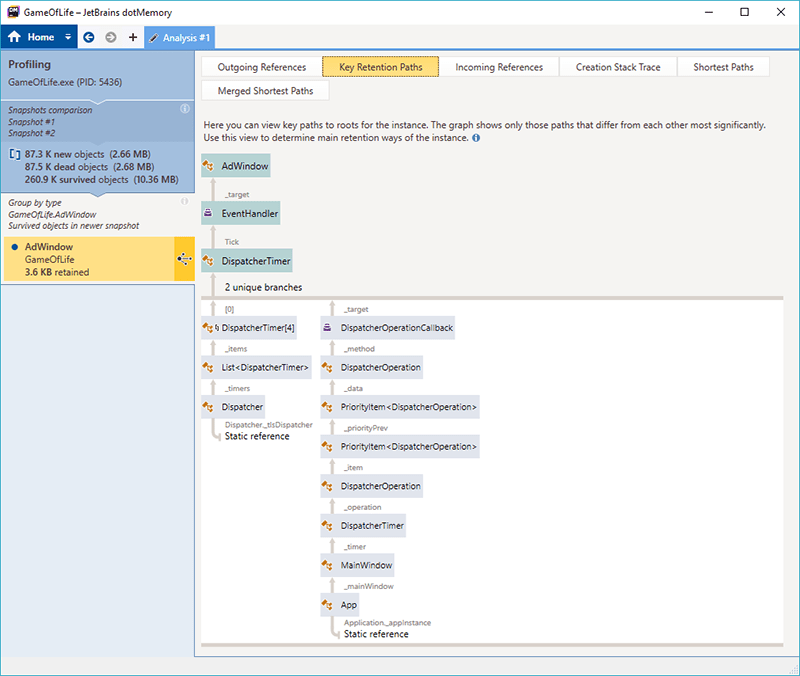
As you can see, the ad window is retained in memory by the event handler
EventHandler, which, in turn, is referenced by an instance of theDispatcherTimerclass.
The text above the
DispatcherTimerinstance gives us one more clue - the instance is referenced via theTickevent handler. Now, let's find out which method subscribes our instance to theTickevent handler and take a thorough look at the code.Click the
EventHandlerinstance in the graph.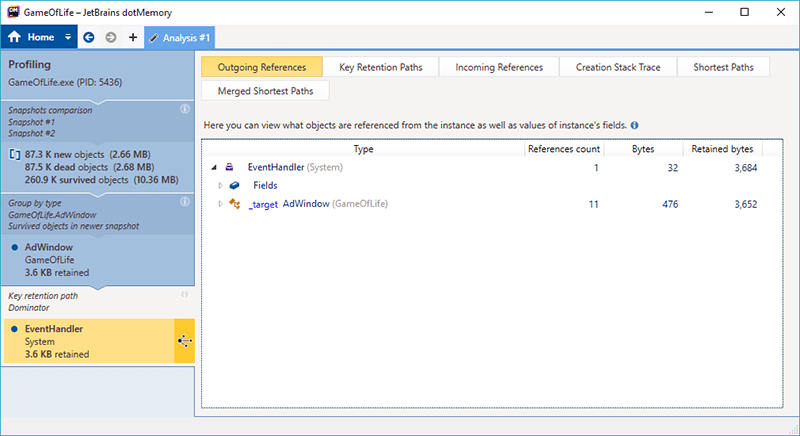
This will open the
EventHandlerinstance* in the default Outgoing References view. Now, all we need is to determine the method that creates our instance.To quickly find the required method, switch to the Creation Stack Trace view.
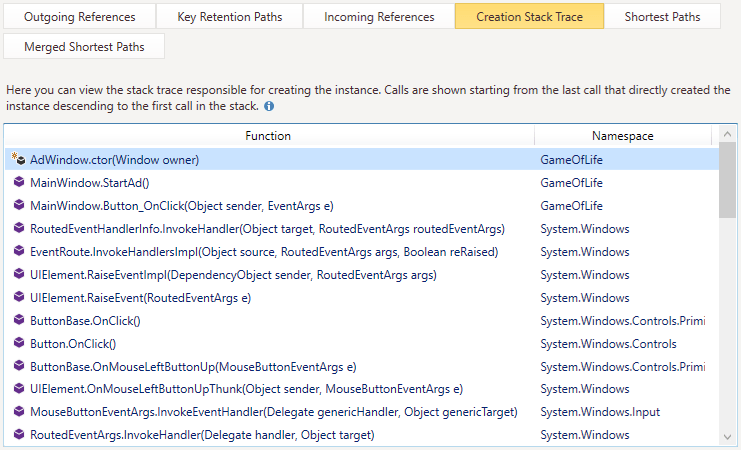
Here it is! The latest call in the stack that actually creates the timer is the
AdWindowconstructor. Let's find it in the code.Switch to Visual Studio with the GameOfLife solution and locate the
AdWindowconstructor.public AdWindow(Window owner) { ... _adTimer = new DispatcherTimer {Interval = TimeSpan.FromSeconds(3)}; _adTimer.Tick += ChangeAds; _adTimer.Start(); }As you can see, our ad window uses the
ChangeAdsmethod to handle the event. But why is the ad window kept in memory after we close it? The thing is that we subscribed the window to the timer's event but forgot to unsubscribe it. Therefore, the fix of this leak is quite simple: we need to add someUnsubscribe()method which should be called when closing the ad window. In fact, the code already contains such a method, and all you need to do is uncomment theUnsubscribe();line in the window'sOnClosedevent. Finally, the code should look like this:protected override void OnClosed(EventArgs e) { Unsubscribe(); base.OnClosed(e); } public void Unsubscribe() { _adTimer.Tick -= ChangeAds; }Now, to make sure the leak is fixed, let's build our solution and run the profiling again. To do this, you can repeat the steps Step 2. Get snapshots and Step 3. Compare Snapshots.
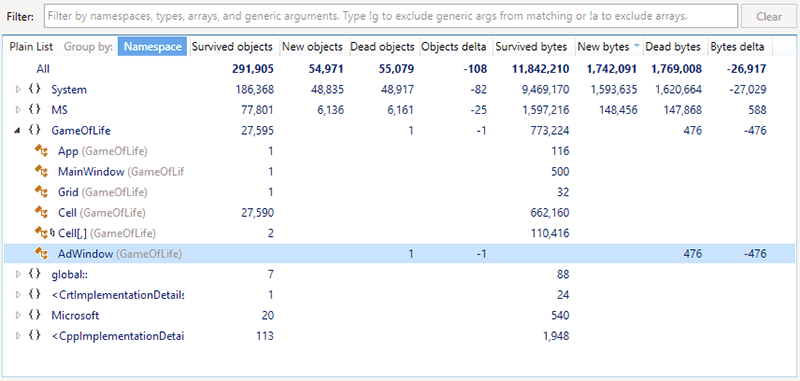
That's it! The
AdWindowinstance is now in the Dead objects column which means it was successfully collected by the time of getting the second snapshot. The leak is fixed!
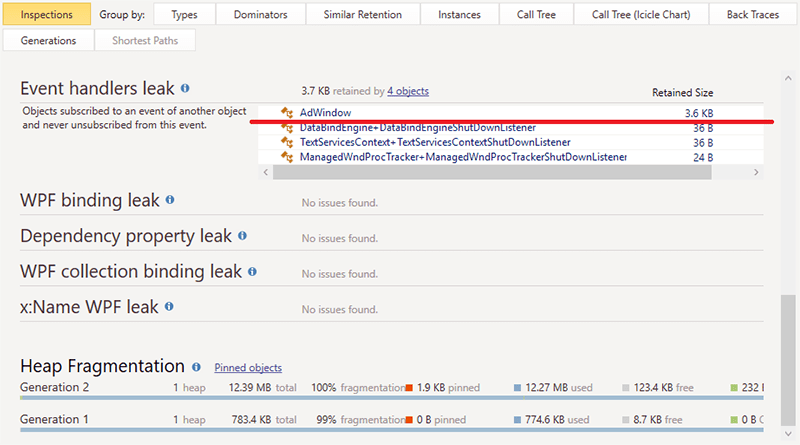
Truth be told, this kind of leak does occur quite often. So often, in fact, that dotMemory automatically checks your app for this type of leaks.
Thus, if you open the second snapshot that contains the leak and look at the Inspections view, you'll notice that the Event handlers leak check already contains the AdWindow object.
Step 5. Check for other leaks
We've fixed the event handler leak, and the ad window is now successfully collected by garbage collector. But what about the timer that caused the leak? If everything works fine, the timer should be collected as well and should be absent in the second snapshot. Let's take a look.
Open the second snapshot in dotMemory. To do this, click the Profiling GameOfLife.exe step (the beginning of your investigation) in the Analysis Path and then click the Snapshot #2 link for the second snapshot.
Open the Group by Types view for the snapshot by clicking Types.
In the opened Group by Types view, enter dispatchertimer in the filter field. This will narrow the list down, leaving only objects that contain this pattern in their class names. As you can see, there are 7
System.Windows.Threading.DispatcherTimerobjects in the heap.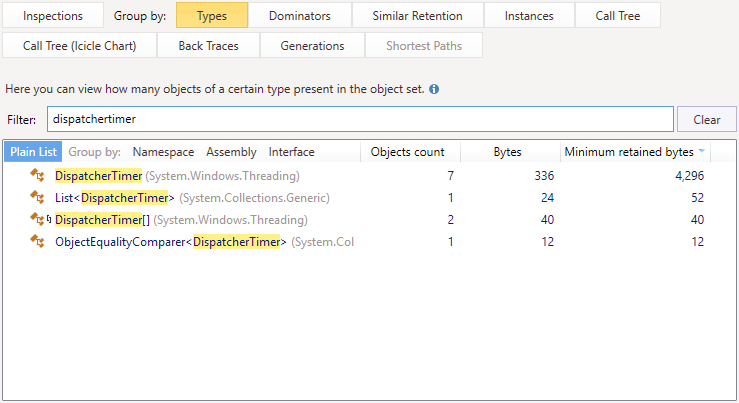
Open this object set by double-clicking it.
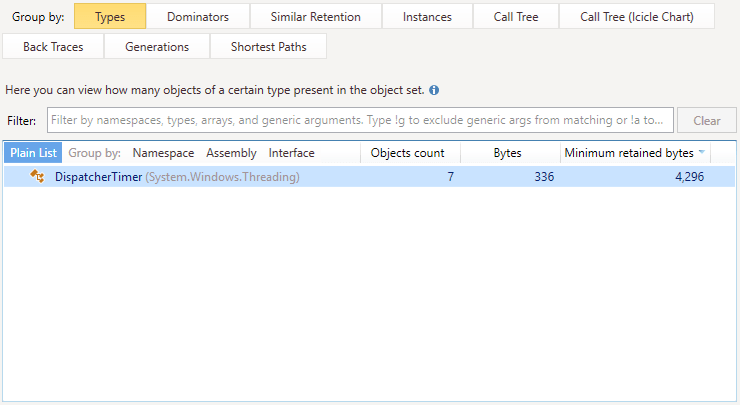
This will open the set in the Group by Types view. Now, we need to ensure that this set doesn't contain the timer created by the ad window. As the timer was created in the
AdWindowconstructor, the easiest way to do this is to look at the set using the Back Traces view.Click Back Traces in the list of views. The view will show us calls starting from the one that directly created the object, and descending to the first call in the stack.
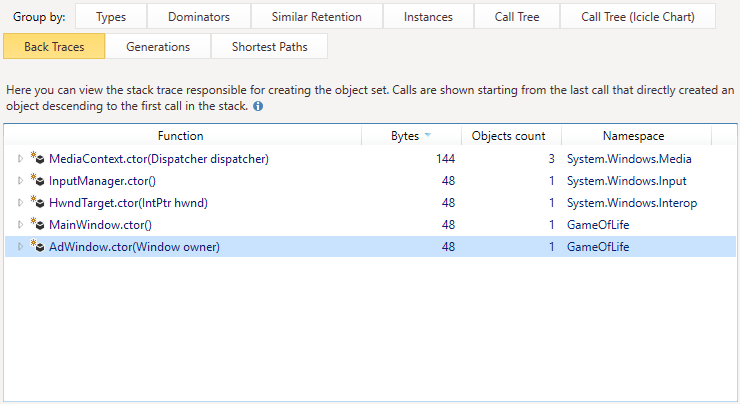
Unfortunately, the
AdWindow.ctor(Window owner)call is still here, meaning that the timer created by this call was not collected. It exists in the snapshot regardless of the fact that the ad window was closed and removed from memory. This looks like one more memory leak that we should analyze.Double-click the
AdWindow.ctor(Window owner)call. dotMemory will show us the instance of theDispatcherTimerclass created by this call. By default, the Outgoing References view will be used. We, in turn, want to find out how this instance is retained in memory. So, let's use the Key Retention Paths view.Click Key Retention Paths. As you can see, there are two main retention paths.
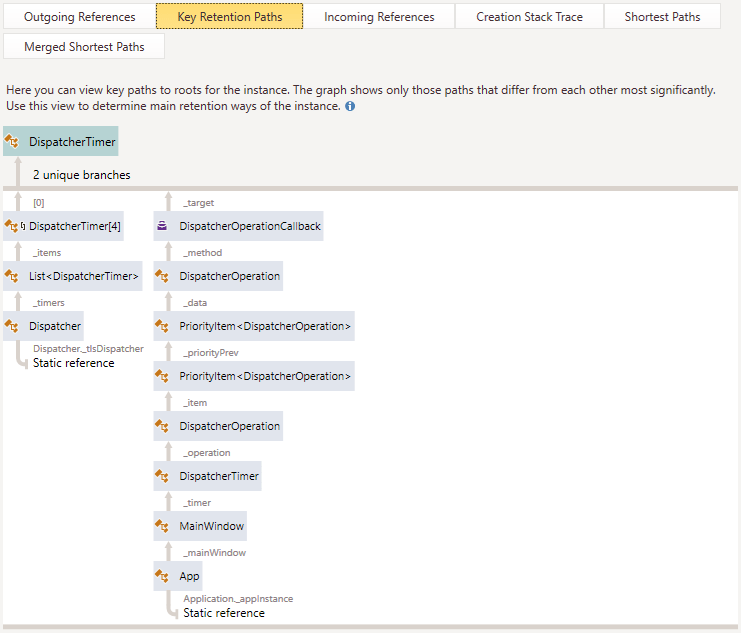
The first retention path of our timer leads us to the
DispatcherTimerlist, which is global and stores all timers in the application. The second way shows that the timer is also retained by theDispatcherOperationCallbackobject. This object is a delegate that is created when you run the timer. This means that the timer is still running. One peculiar thing of theDispatcherTimerclass is that the instance is removed from the global timer list only after the timer is stopped. Therefore, to fix the leak, we must stop the timer before the ad window is closed. Let's do this in the code!Open the AdWindow.cs file which contains the implementation of the
AdWindowclass. Actually, the fix will be quite simple. All we need to do is add theadTimer.Stop();line to theUnsubscribe()method. After the fix, the method should look like this:public void Unsubscribe() { _adTimer.Tick -= ChangeAds; _adTimer.Stop(); }Rebuild the solution.
Repeat Step 2. Get snapshots.
Open the second snapshot in the Group by Types view and find all objects of the
System.Windows.Threading.DispatcherTimertype.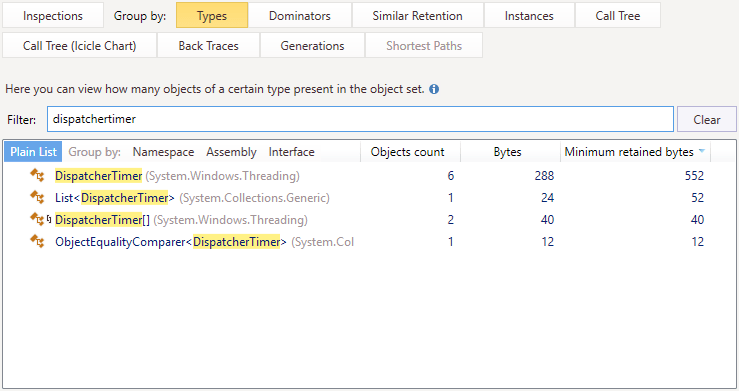
As you can see, there are only 6
DispatcherTimerobjects instead of 7. To ensure that garbage collector collected the timer used by the ad window, let's look at these timers using the Back Traces view.Double-click the DispatcherTimer objects and then click Back Traces in the list of views.
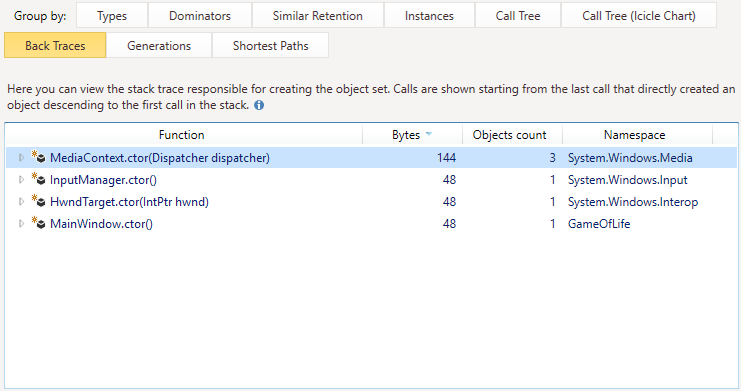
Great! There is no
AdWindowconstructor in the list, which means that the leak has been successfully fixed.
Of course, this type of leak doesn't seem critical, especially for our application. If we didn't use dotMemory, we may have never even noticed the issue. Nevertheless, in other apps (for example, server-side ones working 24/7) this leak could manifest itself after some time by causing an OutOfMemory exception.