Optimize App Performance and Memory Traffic
It is well known that memory traffic impacts heavily on application performance: The higher the traffic, the slower your app. The problem is not in how frequently your application allocates memory (that is almost free as far as performance goes), but in how your application collects memory that's no longer needed. The convenience of the garbage collection (GC) mechanism that does this, unfortunately, has its cost.
First, GC itself demands some CPU time. For example, one of its stages is the detection of unused objects, a complex operation involving building object reference graphs. Second, to perform the Gen0 and Gen1 GCs*, garbage collector must obtain exclusive access to a part of the managed heap. This, in turn, suspends all managed threads except the one that triggered the "blocking GC." As the user interface thread is also suspended, users may experience UI freezes at these moments.
That is why you should always try to optimize your application to reduce memory traffic and minimize the impact of GCs on app responsiveness.
In this tutorial, we will learn how to use timeline profiling to detect excessive GCs and their causes.
Sample application
We use the same basic sample application as in the Get Started with Timeline Profiling tutorial. This application is used to reverse lines in text files, e.g. ABC => CBA.
The source code for the app is available at github.

With the Select Files button, a user chooses the text files to be processed. The Process Files button runs a separate BackgroundWorker thread (named FileProcessing) which reverses lines in the files. A label in the left-hand corner of the main window displays the progress. After the processing is finished, the label shows All files were successfully processed.
Imagine the following scenario: When testing the application, you find out that text files are processed not as fast as you expected. Moreover, in some cases you experience minor lags during file processing.
Let's use timeline profiling to analyze these performance drawbacks!
Step 1. Running the profiler and getting a snapshot
Open the MassFileProcessing.sln solution in Visual Studio.
Run the profiler by choosing .
In Profiling type, select Timeline.
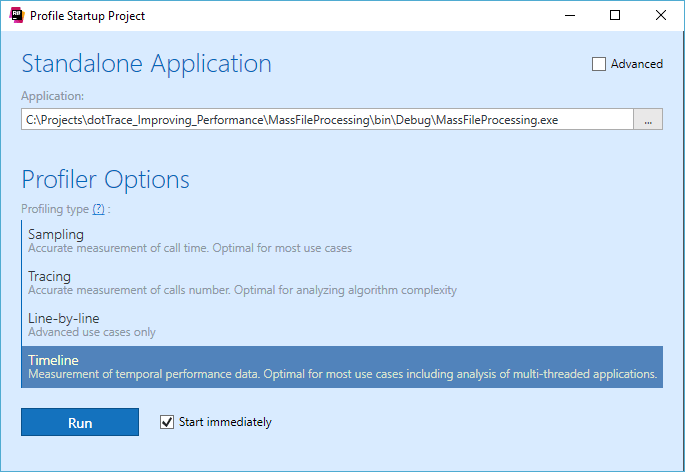
Click Run. dotTrace will run our application and display a special controller window used to control the profiling process.

Now, let's try to reproduce a performance issue in our app.
Click Select Files and choose five text files that come with the application in the Text Files folder.

Click Process Files to start file processing.
Once the processing is over, collect a timeline profiling snapshot by clicking Get Snapshot and Wait in the controller window. The snapshot will be opened in separate Performance Profiler tool window in Visual Studio.
Close the application. This will also close the controller window.
Step 2. Starting analysis
In the Performance Profiler tool window, click Show Threads. This will open a list of application threads in a separate Threads tool window.
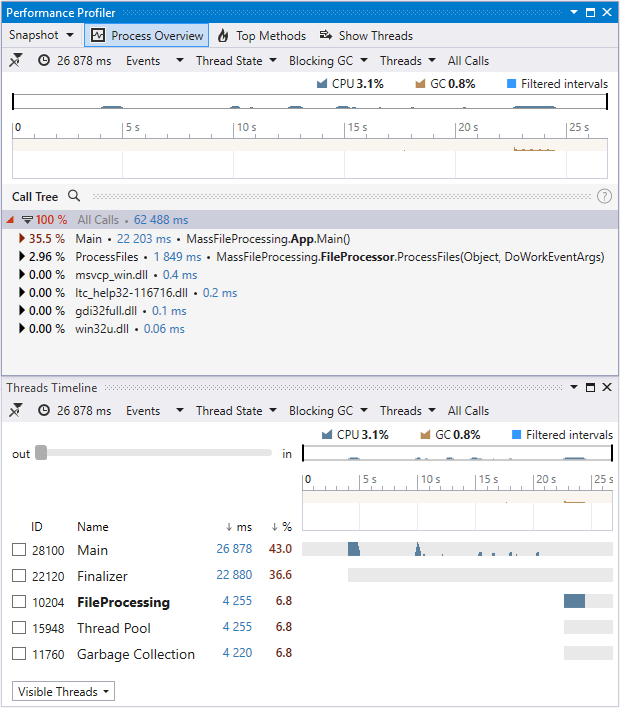
You can see that dotTrace has detected several managed threads. These are the Main thread, the Garbage Collection thread that is used to perform background GC, and the FileProcessing thread* used to process files. In addition, there are two threads that do no work: the Finalizer thread and an auxiliary Thread Pool.
As we are concerned with slow file processing, let's zoom into the period where the FileProcessing thread processes files. To do this, use Mouse Wheel on the Threads diagram.
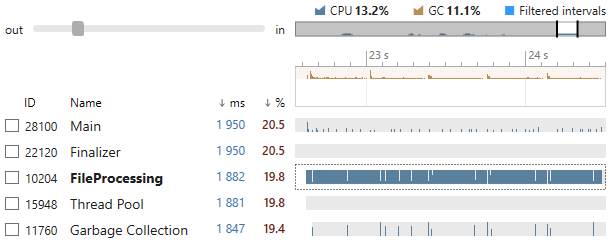
This automatically adds the filter by the visible time interval (1950 ms). Note how this filter affects others: all values are recalculated for the visible time range. The filter now applied to the snapshot data is "Select all time intervals within the visible time range for all threads". Let's remember 2 seconds as the approximate time required for processing files.
On the process overview diagram (in the top of the Threadswindow), look at the GC bar. It appears that many blocking GCs are performed during file processing. This indicates large memory traffic that, without any doubts, impacts application performance.
Now, let's find out what's really behind this traffic. There are two ways* this can be done:
Identify the threads and methods that are running during the GCs. These must be the threads and methods that toggled these collections.
Identify the methods that allocate the major part of memory. The logic is simple: the main reason for toggling GCs is resizing a heap due to memory allocation. Thus, if a method allocates memory a lot, it triggers GCs a lot as well.
Looking ahead, we can tell that the second way is much easier and slightly more reliable. Nevertheless, for educational purposes, let's try both.
Step 3. Where does memory traffic come from? Analyzing garbage collections
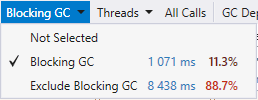
In the list of filters on the top of the Threads window (or the Performance Profiler window), select the Blocking GC value in the Blocking GC filter. The resulting filter will be "Select all time intervals within the visible time range for all shown threads where blocking GCs take place".
Now, let's identify the thread where the GCs happen.* For example, we can suppose that this was the Main thread.
Select the Main thread on the Threads diagram. The resulting filter is now "Select all time intervals within the visible time range on the Main thread where blocking GCs take place".
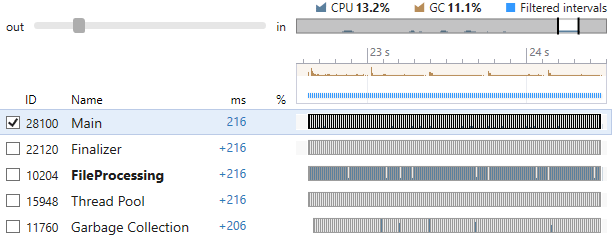
Open and take a look at the Thread States filter. Now, it shows what the main thread did during all those GCs. Most of the time (97.3%) it was Waiting. This means that GC took place on some other thread (obviously on the FileProcessing thread) and the main thread had to wait until the GCs were finished.
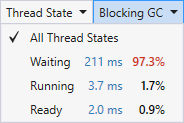
Now, let's find out what method in the FileProcessing thread is to blame for all those GCs.
Remove the filter by Main thread. To do this, clear the corresponding check box in the list of threads.
Instead, select the FileProcessing thread in the list. The resulting filter is now "Select all time intervals within the visible time range for the FileProcessing thread where blocking GCs take place".
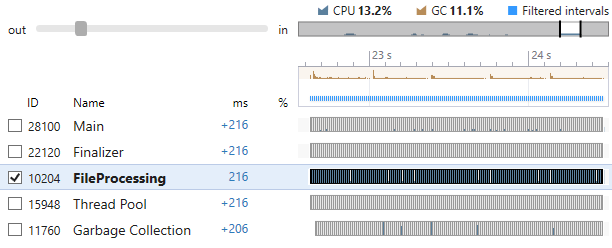
Look at the Thread State filter. It shows that 99.1% of the GC time the FileProccessing thread was Running. This confirms that this thread is responsible for these GCs.
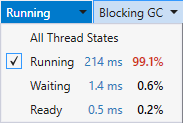
Select Running in Thread State.
In the Performance Profiler tool window, click Hotspots to see the list of user methods with the highest own time.

Taking into account all applied filters, Hotspots now shows the top methods* that triggered the GCs. As you can see,
StringReverser.Reverseis the method that probably generates most of the memory traffic in the application.
Step 3. Where does memory traffic come from? Analyzing memory allocations
Now let's try a simpler way of analyzing memory traffic. As we mentioned earlier, the idea is to identify methods that allocate the largest amounts of memory.
Remove all filters by clicking the
 button either in the Performance Profiler or Threads tool window.
In the Events filter, select Memory Allocation*.
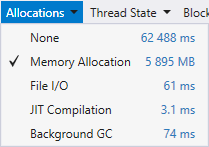
Look at the Threads diagram. The FileProcessing thread allocates enormous amounts of memory – 5882 MB. There is no doubt it's to blame for high memory traffic in our app.
Look at Hotspots. Now, it sorts methods by the amount of allocated memory. The
StringReverser.Reversemethod is far behind with 5496 MB.
Step 4. Improving the code
Let's look at method's code and try to find out what is wrong with it.
Right click the
StringReverser.Reversemethod in Hotspots and select Navigate to Code in the context menu.
Look at the code. It appears that this method is used to reverse lines from a text files. It takes a string on input and returns the reversed string.
public string Reverse(string line) { char[] charArray = line.ToCharArray(); string stringResult = null; for (int i = charArray.Length; i > 0; i--) { stringResult += charArray[i - 1]; } return stringResult; }Apparently, the problem is in the way it reverses a string. The thing is that string is an immutable type – its contents cannot be changed after it is created. This means that each time we add a character to
stringResultwith the+=operation, a new string is allocated in memory. It would be much more effective to employ a specialStringBuilderclass or handle the string as an array ofcharand use theReversemethod. Let's try the second option.Correct the
StringReverser.Reversemethod as shown below.public string Reverse(string line) { char[] charArray = line.ToCharArray(); Array.Reverse(charArray); return new string(charArray); }
Step 5. Verifying the fix
Rebuild the solution and perform profiling one more time as described in Step 1.
After the snapshot is opened, switch Events to Memory Allocation.
Look at the Threads diagram. Our improvement works! Memory traffic has reduced from almost 6 GB to 166 MB for the FileProcessing thread.
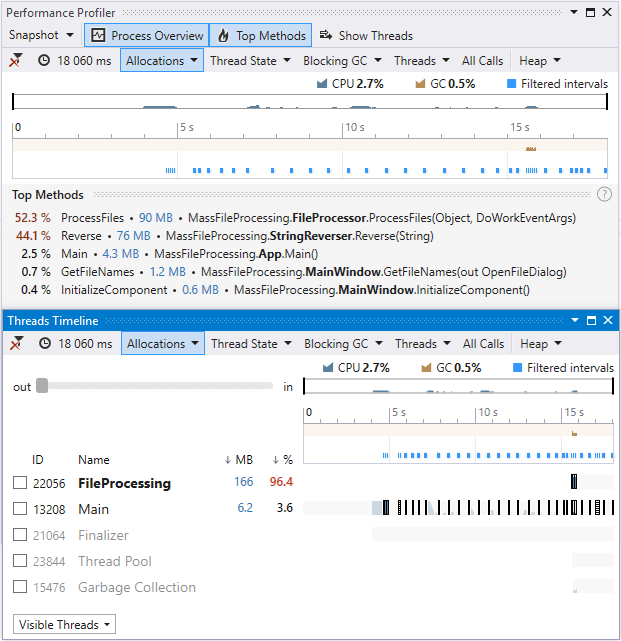
If you zoom into the time interval where FileProcessing processed files, you'll see that file processing has sped up significantly. Now, it takes only about 300 ms to process all files, compared to 2 s before the fix.